Monday, March 13, 2017

AWS redshift quick overview

1. AWS Redshift Overview

1.1. What is Redshift

  • Redshift is a custom build database in AWS environment.
  • Redshift is a fully managed data warehouse database used for storing large amounts of data for business intelligence applications.
  • Redshift uses “Simple SQL” language.

1.2. Cost

  • Start a .25/hour, about $1000/TB
  • Instance types:
    • DC1 - use SSD scalel from 160GB to 326TB
    • DC2 - use HHD, scale from 2TB to 2PB
  • Storage is provisioned as part of the node. AWS charge by the node.
  • You can use on-demand or reserved instance types no spot instance is allowed.
  • You can mix on-demand and reserved instance in a cluster.
  • You can shut down a cluster if it is not being used. When the cluster is restarted, the data will be loaded from the final snapshot stored on S3.

2. Redshift Architecture

2.1. Single or multi-nodes setup

  • Redshift itself can be a single node or multi-nodes cluster.
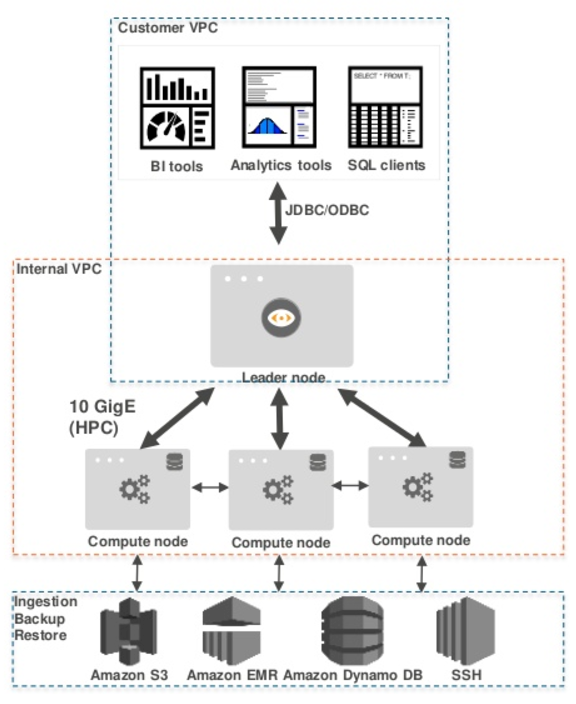
  • You can access the database with AWS SDK or tools use JDBC/ODBC. When a user access redshift with an SQL statement:
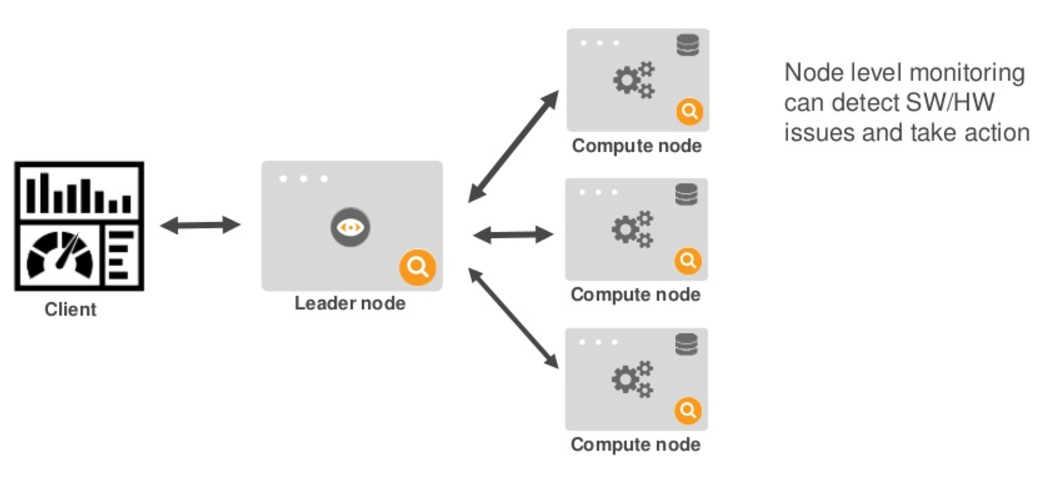
    • Redshte distributes the query from the “leader” node in parallel across all the cluster’s compute nodes
    • The compute nodes work together to execute the queries and return the data back to the leader node which then organized the resift and send it back to the client requesting the data from the cluster.

The following diagram shows a multi-node Redshift setup
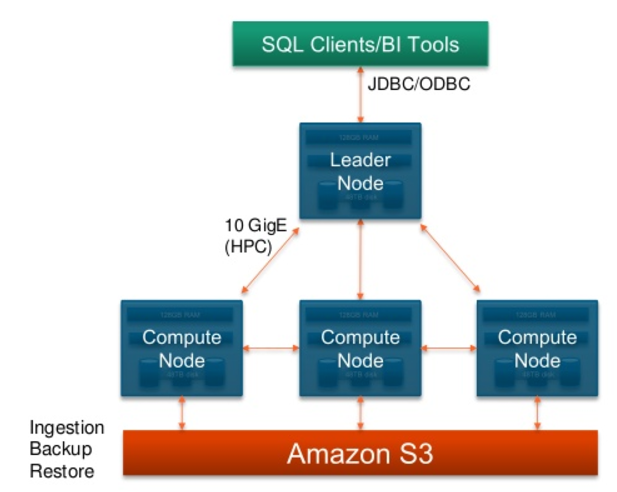
Functions of different component
  • Leader node
    • Simple SQL endpoint
    • Store metadata
    • Optimized query plan
    • Coordinate query execution
  • Local columnar storage
    • Parallel/distributed execution of all queries
    • Backup, restore, resizes
  • S3 - store the snapshot

2.2. Redshift node fault tolerance

Redshift runs in a single AZ only, no multi-AZ setup.

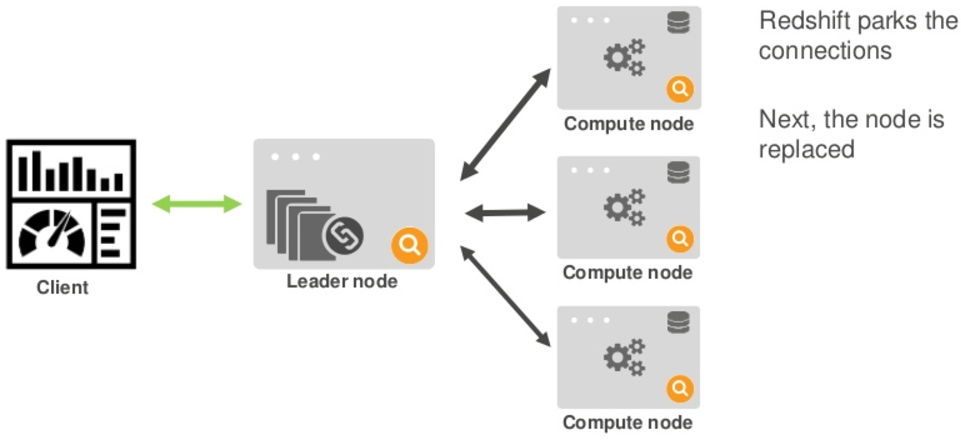
Although there is no HA setup over multi-AZ, Redshift nodes are continuously backed up to AWS S3 and in the event of a failed node in the cluster, Redshift will replace the nodes and restore the data from backup.

The following diagrams illustrate how Redshift perform node recovery
3. Resizing Redshift

Scalability is the key advantage of using Redshift in AWS:

  • We can start with a small single node cluster and scale up to larger and multi-node cluster as demain increased
  • You can choose different instance type for redshift, each instance type has different cpu power and storage.
  • As the performance or capacity (storage) needs changes, all you need to do is changing the number of of nodes/instance type.  
  • Amazon Redshift allow you to change the cluster size that with CLI or with a few clicks on the console
  • During the process of resizing, the existing cluster is placed on the read only mode and the data will be copied from that to the new one in parallel. The queries against the old one can be performed even with the new one being provisioned. Amazon Redshift removes the old cluster when the new one is provisioned.

The following diagram illustrate adding a data node to a cluster

4. Redshift cluster shutdown vs delete

  • Amazon Redshift perform regular automated backups. It is called automated Snapshot feature. It continuously backs up data on the cluster to Amazon S3. It is a continuous, incremental and automatic backing up of data. Amazon Redshift does it for a user defined period such as one to thirty-five days.
  • When you shut down a Redshift cluster, a final snapshot will be made.
  • When you delete a Redshift cluster, no final snapshot will be created
  • Both shutdown or delete will remove the all automated snapshots. Except the final snapshot if you had shutdown the cluster.
  • So if a Redshift was deleted, you can not recover database unless you had performed a manual snapshot before it was deleted.

5. Redshift backup and restore

5.1. Using Redshift snapshots

  • Point-in-time snapshots are stored to S3 by Redshift automatically. User define the frequency of the snapshots during cluster configuration.
  • A snapshot contain the following data
    • Cluster configuration:
      • Number of nodes
      • Type of nodes
      • Decryption keys
    • Database data
  • For cluster backup, we can use Redshift data snapshots.
  • User can initial a manual snapshot.
  • User can restore a Redshift DB from snapshot by launching a new cluster and importing the data from the snapshot

5.2. Using flat files

You can use Redshift SQL statements to import or export Database with files:
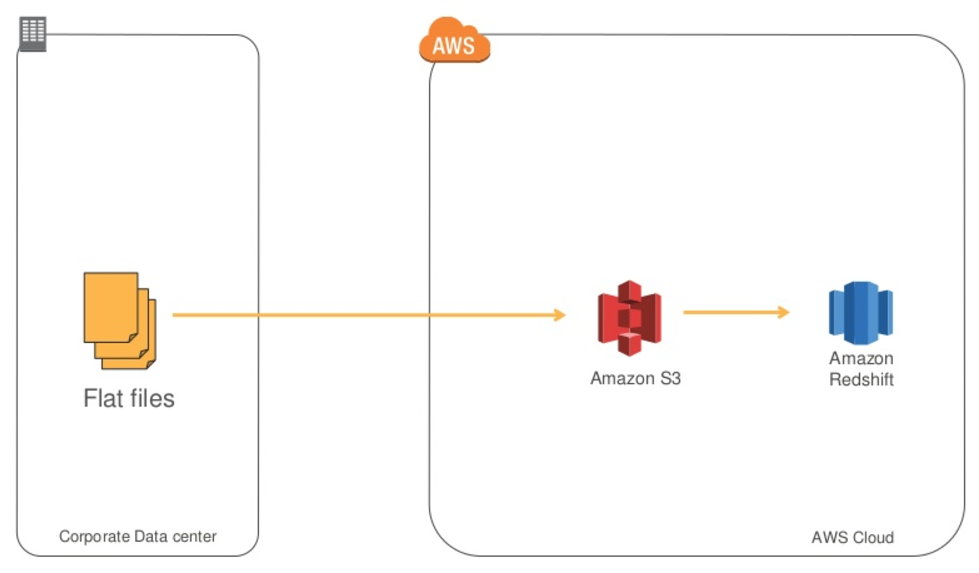
  • To export DB to a file on S3, you can use the Redshift UNLOAD SQL command.
  • To import DB from a file on S3, you can use the Redshift copy command

  • You can use multiple files for input to maximize throughput.

6. DR consideration

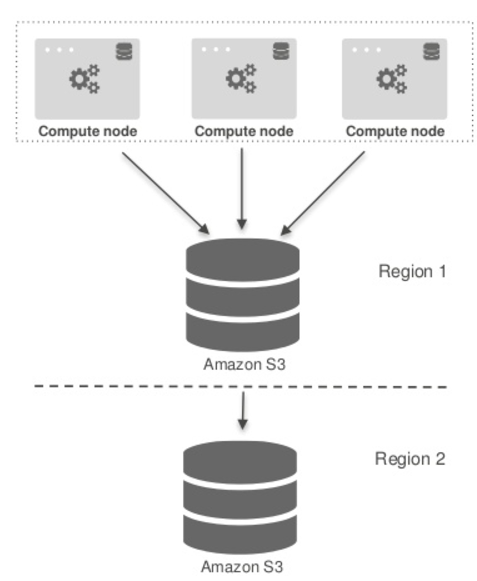
Snapshots can be copied from one region to another
  • Manual Copy : user can copy the snapshot manually
  • Automatic Copy: Redshift can be setup with automatically copy a snapshot from one region to another.
  • User can setup retention period for how long to save the automatically copied. Snapshots
    • Customer needs to pay for data transfer charge for copying data between regions.

The following diagram illustrate Redshift cross region data copy
7. Security is build-in

  • All blocks on disk and S3 are encrypted
  • SSL is used in between data in transit
  • VPC for network isolation
  • Audit logging with CloudTrail
Saturday, March 11, 2017

Lambda, ELK and CloudTrail logs


1 Introduction

1.1 Why use ELK with CloudTrail?

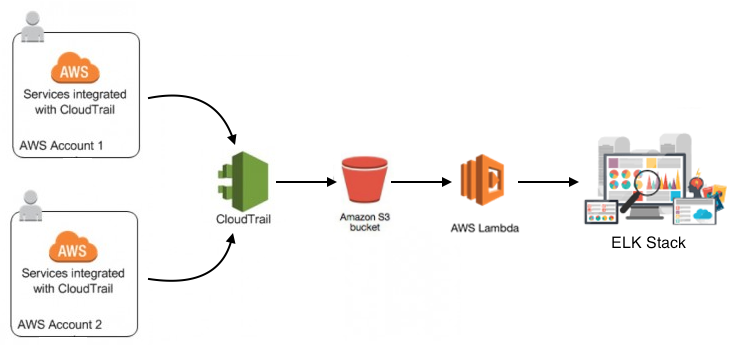
AWS CloudTrail is a service that records API calls made on your account and saves log files in a Amazon S3 bucket. In theory, you can track user activities and API usage with this AWS feature. However, when you actually need to read and search the Cloudtrail logs, you will find out It is not an easy task.


Following are the difficulties
  • The cloud trail file are gzip file stored on the S3 bucket, to view them, you have to download the file and unzip it.
  • The log data are json data, it is not an easy readable data format for human.
  • There are tons of logs file. Cloudtrail logs everything, and you might be facing thousands and thousands of log files to analysis.

In summary, we need a tool to work with CloudTrail logs. For me, ELK stack is free and easy to setup. So I decide to feed my Cloudtrail log files into a ELK stack.

1.2 My Journey

When I start looking for solution, I googled around and found the following two solutions sound promising:


First I tried the logstash integration method, but I could not get the needed plug-in installed successfully, so I gave up.


Then, I follow the 2nd post to use AWS Lamba function to pull the CloudTrail logs from S3 bucket and save it in the ELK stack. Although the original post is very detail with the needed coding but I found out I still struggle with it and have to spend a good amount of time to get it work right. This prompt me to write this post and share how I get it works.

2 Prerequisites
You need to have the following to configure this setup:
  • Basic level of AWS expertise to work with AWS console and setup services
  • Basic knowledge of Lambda and Python scripting. If you are not, try to read the doc and watch some introduction video on youtube. Lambda and Python is not difficult to learn once you get some basic ideas.
  • You had set up cloudtrail and save the logs to a S3 bucket
  • You had set up an ELK stack. See my other post for instruction

3 Step by step instructions

3.1 Enable Elasticsearch remote access

By default, the Elasticsearch software on your ELK setup only listen to localhost, you need to change it.


Edit /etc/elasticsearch/elasticsearch.yml and modify the network.host line like the following:
. . .
network.host: 0.0.0.0
. . .


Restart elasticsearch
$ sudo service elasticsearch restart


3.2 Modify the AWS Security Group for the ELK

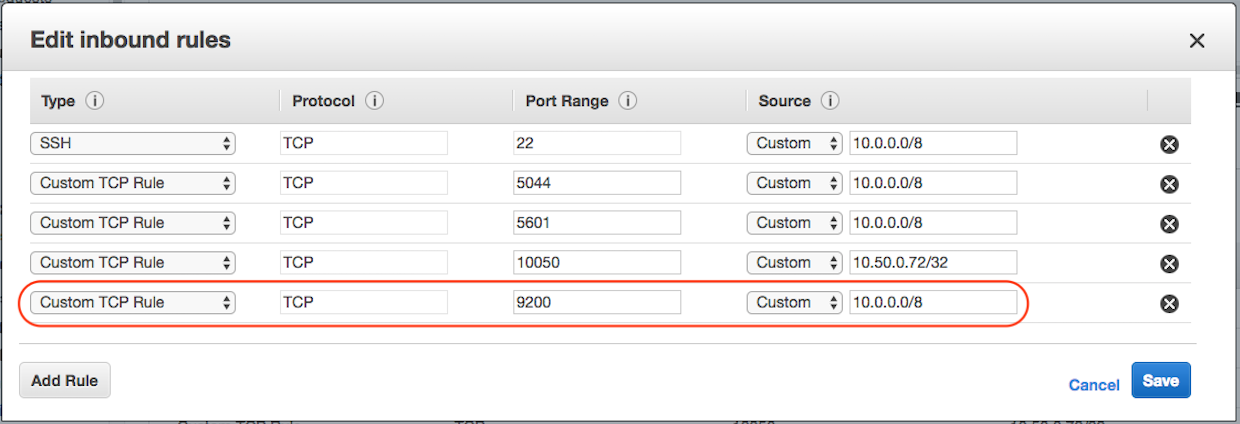
For the security used for your ELK server and open the port 9200 for inbound traffic.


You don’t have to worry about the security at this moment, you can modify it to only connect to the Lambda function's security group later.


Now, login to remote Linux box and run the following to make sure you can access  Elasticsearch remotely.


$ curl -X POST 'http://10.254.10.230:9200/testing/helloworld/1' -d '{ "message": "Hello World!" }'
{"_index":"testing","_type":"helloworld","_id":"1","_version":1,"found":true,"_source":{ "message": "Hello World!" }}

3.3 Create IAM role for Lambda function

You need to create an IAM role for the Lambda function with two policies.
  1. Sign in to the IAM console at https://console.aws.amazon.com/iam/.
  2. Follow the steps in Creating a Role to Delegate Permissions to an AWS Service in the IAM User Guide to create an IAM role (execution role). As you follow the steps to create a role, note the following:
    • In Role Name, use a name that is unique within your AWS account (for example, lambda-cloudtrail-role).
    • In Select Role Type, choose AWS Service Roles, and then choose AWS Lambda. This grants the AWS Lambda service permissions to assume the role.
    • In Attach Policy, choose AWSLambdaExecute and AWSLambdaVPCAccessExecuteRole.


The AWSLambdaExecute policy allow the Lambda function to log message and access S3 buckets.
{
 "Version": "2012-10-17",
 "Statement": [
   {
     "Effect": "Allow",
     "Action": [
       "logs:*"
     ],
     "Resource": "arn:aws:logs:*:*:*"
   },
   {
     "Effect": "Allow",
     "Action": [
       "s3:GetObject",
       "s3:PutObject"
     ],
     "Resource": "arn:aws:s3:::*"
   }
 ]
}


The AWSLambdaVPCAccessExecuteRole policy allow us to place the Lambda function in a VPC and access to EC2 instance.
{
 "Version": "2012-10-17",  "Statement": [    {      "Effect": "Allow",      "Action": [        "logs:CreateLogGroup",        "logs:CreateLogStream",        "logs:PutLogEvents",        "ec2:CreateNetworkInterface",        "ec2:DescribeNetworkInterfaces",        "ec2:DeleteNetworkInterface"      ],      "Resource": "*"    }  ]}


3.4 Download source code

You can download the code shared by Fernando Battistella from https://github.com/argais/cloudtrail_aws_es


If you install git on your desktop, you can download it with

3.5 Create a template on ElasticSearch for CloudTrail log data

  • Assume you had downloaded all files from  https://github.com/argais/cloudtrail_aws_es
  • Copy the elastic_search_cloudtrail_template.json on your ELK host
  • Edit elastic_search_cloudtrail_template.json and remove the first line starting “Put /_temp….”
  • Now the file should like the following:
{
 "template" : "logstash-*",
 "settings" : {
   "index.refresh_interval" : "5s"
 },
 "mappings" : {
   "_default_" : {
     "_all" : {"enabled" : true, "omit_norms" : true},
     "dynamic_templates" : [ {
       "message_field" : {
         "match" : "message",
         "match_mapping_type" : "string",
         "mapping" : {
           "type" : "string", "index" : "analyzed", "omit_norms" : true,
           "fielddata" : { "format" : "enabled" }
         }
       }
     }, {
       "string_fields" : {
         "match" : "*",
         "match_mapping_type" : "string",
         "mapping" : {
           "type" : "string", "index" : "analyzed", "omit_norms" : true,
           "fielddata" : { "format" : "enabled" },
           "fields" : {
             "raw" : {"type": "string", "index" : "not_analyzed", "doc_values" : true, "ignore_above" : 256}
           }
         }
       }
     }, {
       "float_fields" : {
         "match" : "*",
         "match_mapping_type" : "float",
         "mapping" : { "type" : "float", "doc_values" : true }
       }
     }, {
       "double_fields" : {
         "match" : "*",
         "match_mapping_type" : "double",
         "mapping" : { "type" : "double", "doc_values" : true }
       }
     }, {
       "byte_fields" : {
         "match" : "*",
         "match_mapping_type" : "byte",
         "mapping" : { "type" : "byte", "doc_values" : true }
       }
     }, {
       "short_fields" : {
         "match" : "*",
         "match_mapping_type" : "short",
         "mapping" : { "type" : "short", "doc_values" : true }
       }
     }, {
       "integer_fields" : {
         "match" : "*",
         "match_mapping_type" : "integer",
         "mapping" : { "type" : "integer", "doc_values" : true }
       }
     }, {
       "long_fields" : {
         "match" : "*",
         "match_mapping_type" : "long",
         "mapping" : { "type" : "long", "doc_values" : true }
       }
     }, {
       "date_fields" : {
         "match" : "*",
         "match_mapping_type" : "date",
         "mapping" : { "type" : "date", "doc_values" : true }
       }
     }, {
       "geo_point_fields" : {
         "match" : "*",
         "match_mapping_type" : "geo_point",
         "mapping" : { "type" : "geo_point", "doc_values" : true }
       }
     } ],
     "properties" : {
       "@timestamp": { "type": "date", "doc_values" : true },
       "@version": { "type": "string", "index": "not_analyzed", "doc_values" : true },
       "geoip"  : {
         "type" : "object",
         "dynamic": true,
         "properties" : {
           "ip": { "type": "ip", "doc_values" : true },
           "location" : { "type" : "geo_point", "doc_values" : true },
           "latitude" : { "type" : "float", "doc_values" : true },
           "longitude" : { "type" : "float", "doc_values" : true }
         }
       }
     }
   }
 }
}


  • On the ELK host and run the following command:


$ curl -XPUT 'http://localhost:9200/_template/logstash' -d@elastic_search_cloudtrail_template.json


  • You should get response like the following:
{"acknowledged":true}


3.6 Create the python script for the Lambda function

I used the original script s3_lambda_es.py as the template and modified it to work with my ELK server.


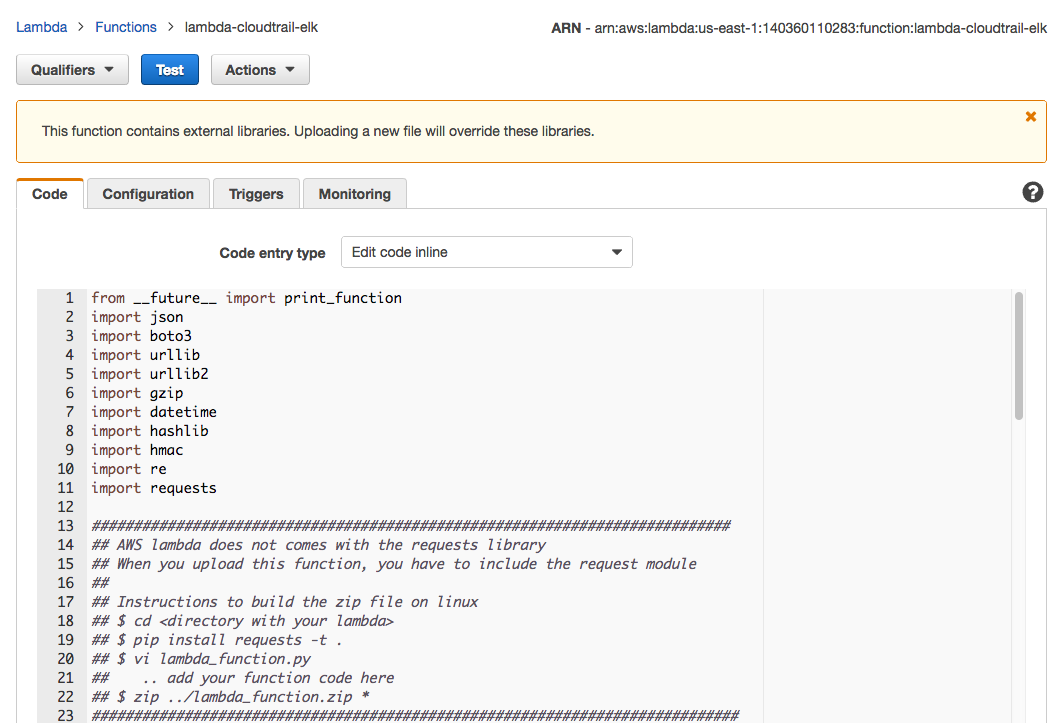
Following is my code, please make sure you modify the host and port value in the code to fit your needs.
from __future__ import print_function
import json
import boto3
import urllib
import gzip
import datetime
import hashlib
import hmac
import re
import requests

############################################################################
## AWS lambda does not comes with the requests library
## When you upload this function, you have to include the request module
##
## Instructions to build the zip file on linux
## $ cd <directory with your lambda>
## $ pip install requests -t .
## $ vi lambda_function.py
##    .. add your function code here
## $ zip ../lambda_function.zip *
#############################################################################

elk_host = "x.x.x.x"
es_port ="9200"

print('Lambda function starting')

s3 = boto3.client('s3')

def lambda_handler(event, context):
   #print("Received event: " + json.dumps(event, indent=2))

   # Get the object from the event and show its content type
   bucket = event['Records'][0]['s3']['bucket']['name']
   key = urllib.unquote_plus(event['Records'][0]['s3']['object']['key'].encode('utf8'))
   
   # make sure it is a cloudtrail log file
   if ( re.match('.*_CloudTrail_.*', key ) and re.match('.*.gz', key ) ):
       print("bucket=" + bucket + " key=" + key)
   else:
       return
       
   # download the cloudtrail log file to /tmp
   tempfile = '/tmp/temp.gz'
   s3.download_file(bucket, key, tempfile)
   
   # unzip cloudtrail log and put it into a variable
   log_content = gzip.open( tempfile, "r")
   
   # use json library to load the cloudtrail records into
   events = json.loads( log_content.readlines()[0])["Records"]
   
   for msg in events:
       # skip useless events for not to flood elasticsearch db
       if ( re.match('Describe.*', msg["eventName"] ) ):
           continue
       
       # adds @timestamp field = time of the event
       msg["@timestamp"] = msg["eventTime"]
       
       # removes .aws.amazon.com from eventsources
       msg["eventSource"] = msg["eventSource"].split(".")[0]
       
       data = json.dumps(msg)
       headers = { "Content-Type": "application/json"}

       # defines correct index name based on eventTime, so we have an index for each day on ES
       event_date = msg["eventTime"].split("T")[0].replace("-", ".")

       #print (msg["eventSource"] + " " + msg["eventName"] + " " + event_date)
       
       # url endpoint for our ES cluster
       url = 'http://' + elk_host + ':' + es_port + '/logstash-' + event_date + '/cloudtrail/'
       print ("url :", url)
       print ("data: ", data)

       # sends the json to elasticsearch
       req = requests.post(url, data=data , headers=headers)

       print ("status code: ", req.status_code )
       print ("text", req.text)
       
       # retry, normally it should not happen
       retry_counter = 1
       while req.status_code != 201 and retry_counter < 4:
           print ("retry", retry_counter, "of 3 - failed sending data to elasticsearch:", req.status_code)

           # send the data to ES again
           req = requests.post(url, data=data, headers=headers)

           # if it worked this time, nice! \o/
           if req.status_code == 201:
               print ("data successfully sent!")
               print ("status code: ", req.status_code)
               print ("text", req.text)
               retry_counter += 1

3.7 Create a zip file

Since the Python script use the module “requests” and it does not included in AWS’s library, we need to pack it with a zip file along with the Python script for the Lambda function.


Create a work directory and download the requests module with pip
$ mkdir my_work_dir
$ cd my_work_dir
$ pip install requests -t .


Now you need to cut and paste the code in the previous section into a file called “lambda_function.py”


Now your directory should have the following:
$ ls
lambda_function.py      requests        requests-2.13.0.dist-info


Zip this entire folder (Very important! The files must be on the root of the zip, not inside a folder)
$ zip -r ../lambda_function.zip *

3.8 Create a Security group for the Lambda function

  • Open the Amazon EC2 console at https://console.aws.amazon.com/ec2/.
  • In the navigation pane, choose Security Groups.
  • Choose Create Security Group.
  • Specify a name (like lambda-cloudtrail) and description for the security group.
  • choose a VPC ID to create a security group for that VPC.
  • Add an inbound rule allow all inbound traffics and click the “Create” button.


3.9 AWS Lambda function

3.9.1 Create the Lambda function

  • Log in to the AWS Management Console and open the AWS Lambda console.
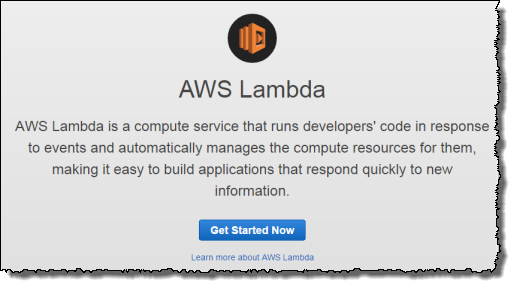
  • If you are first time Lambda user, you have a screen like the following:
Click on “Get Start Now”
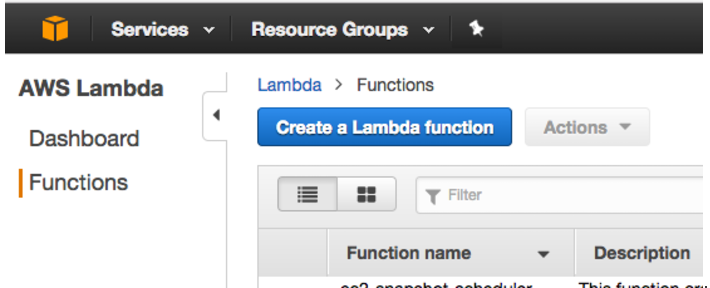
  • If you already created a Lambda function, you will forward to Lambda dash board:
Click on “Create a Lambda function”
  • On the Select blueprint page, select a “S3-get-object-python”

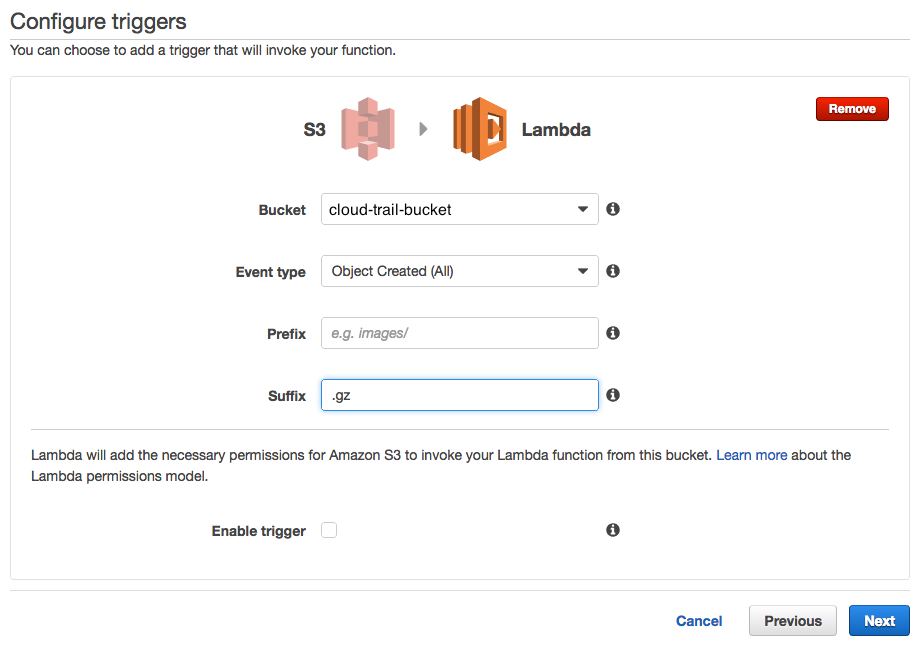
  • Enter the following:
    • Bucket -> the bucket name you store the CloudTrail log files
    • Event type -> select “Object Created (All)”
    • Prefix -> leave it blank
    • Suffix -> enter “.gz”

Click next to continue
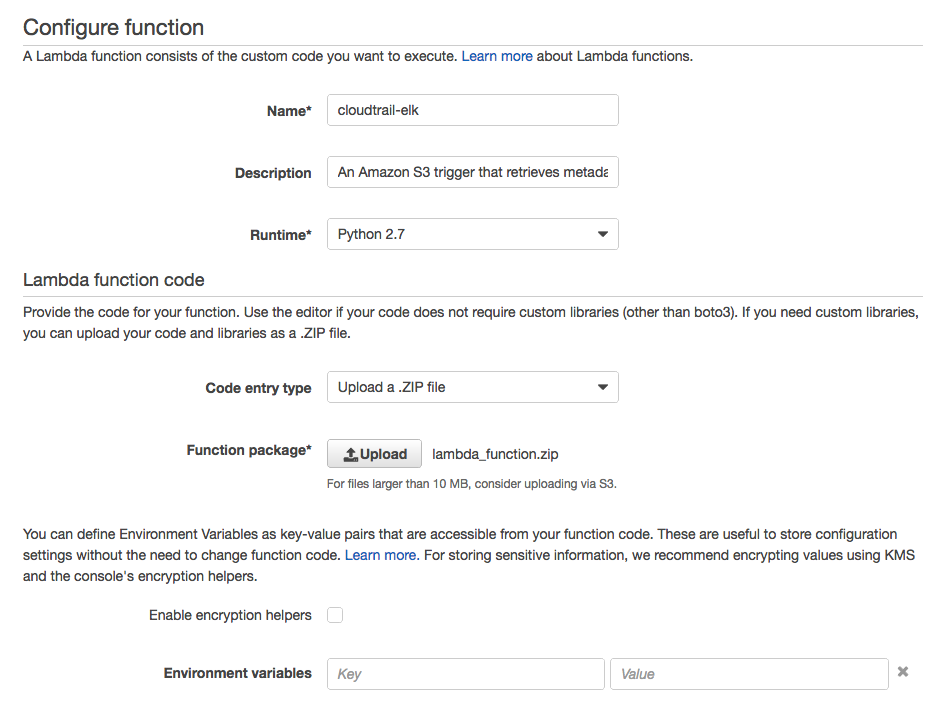
  • Enter the following:
    • Name: enter any name you want
    • Description: enter description
    • Runtime: select “Python 2.7”
    • Code enter type: select “Upload a .ZIP file”
    • Click on the “Upload button” and select the zip file we created in previous step.
    • Environment variables -> leave it alone.
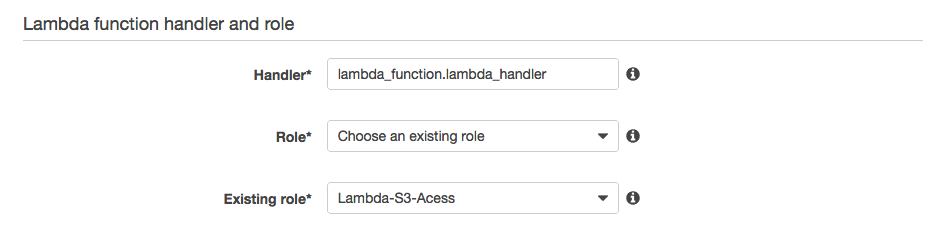
    • Handler -> use the default value “lambda_function.lambda_handler
    • Role -> select “Choose an existing role”
    • Existing role -> select the role for Lambda function created in previous step.


  • Click on the “Advanced settings” to expand the it
    • Memory -> select 1024. (note, the script works with 128M but it runs very slow)
    • Timeout -> use the default “3 second”.
    • DLQ Resource -> leave it blank
    • VPC -> select a VPC
    • Subnets -> select two subnets (it has to be private subnets)
    • Security group -> select the security group we created for Lambda function
    • KMS -> leave it blank


Click Next

  • On the review screen, click “Create function”
  • Now your function is created


3.9.2 Test the Lambda function

  • At this moment, you can test the function by selecting ”Configure
  • test event”,How to do it is beyond the scope of the document. Check out this document on how to set up test Lambda with S3.

  • From the “Input test event” screen
    • Select “S3 Put” template
    • On the key field, select one of your cloudtrail file name from your S3 bucket. For example:

mydir/AWSLogs/123456789012/CloudTrail/us-east-1/2017/03/13/123456789012_CloudTrail_us-east-1_20170313T0000Z_xxxxxyyyyyyzzzzz.json.gz
  • On the arn and name field, enter the the bucket name used for the Cloudtrail logs
  • Click “Save”


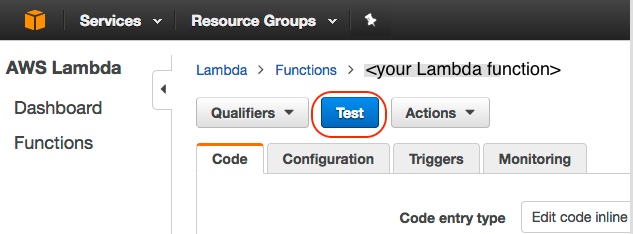
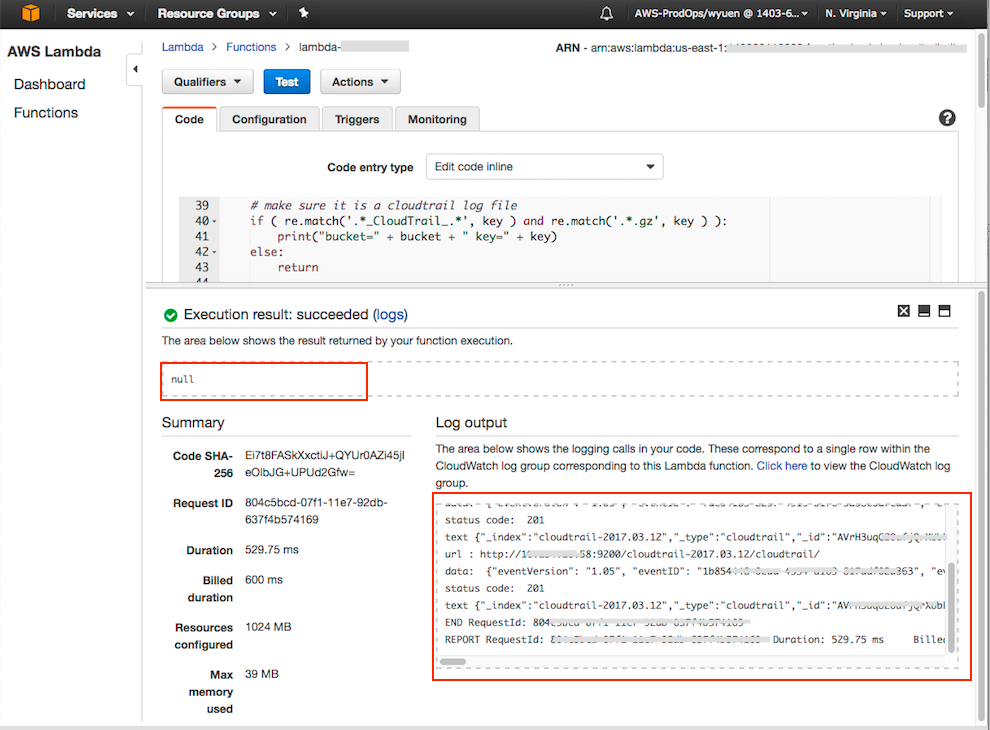
  • Now, you have your test event setup, you could run the test by clicking on the “Test” button on the function


  • You can view the output of the test on the bottom of the Lambda function screen

3.9.3 Enable the Trigger for production

  • Once you confident the setup,
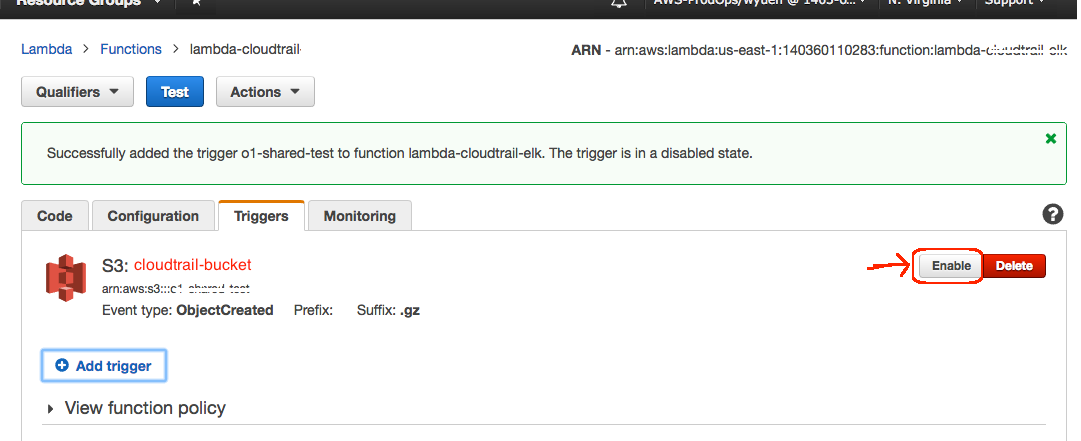
    • Click on the “Triggers” tab
    • Click on “Enable”

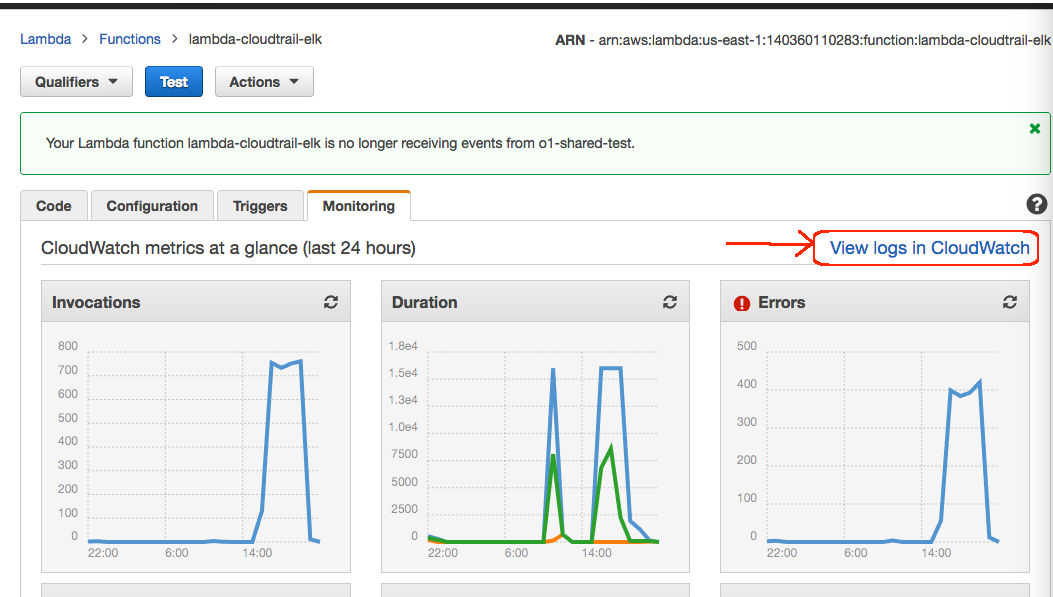
  • Click on Monitor tab to check on the status, you can check the log by clicking on the “View logs in CloudWatch”. (Note: CloudTrail updates the S3 bucket every 5 minutes, you might want to get a cup of coffee now)


  • Assuming no error is found, you can still using Kibana to view your CloudTrail messages

4 Use Kibana to view CloudTrail logs

  • Login to Kibana
  • Click on Discover


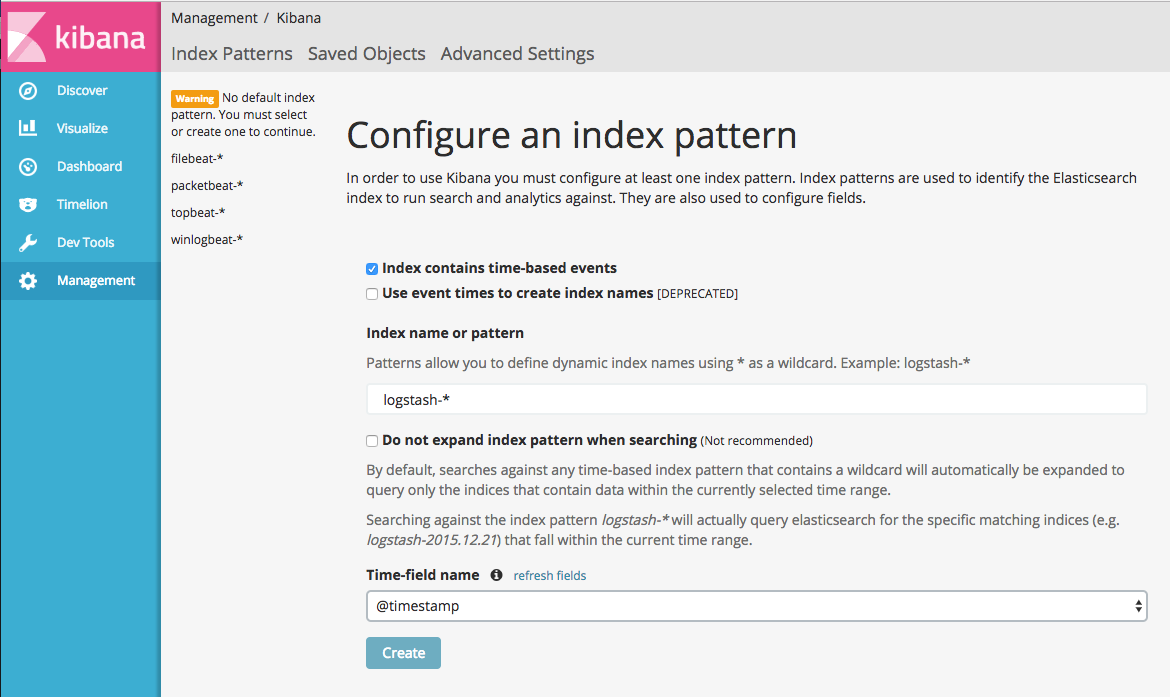
  • On the Time-field name, select “@timestamp”


  • Select a time period large enough to pull your log data (note: CloudTrail uses UTC timestamp, so it will be different from your local time zone).
  • Click on Discovery and it should find your log


Note: You can get details of the cloudtrail records from here.