
1 Introduction
In this post I provide instruction on how to configure the logstash and filebeat to feed Spring Boot application lot to ELK. Check my previous post on how to setup ELK stack on an EC2 instance. And in my next post, you will find some tips on running ELK on production environment.
In the following diagram, the log data flow is: Spring Boot App → Log File → Filebeat -> Logstash → Elasticsearch -> kibana

2 Understand Spring Boot Application Logs
The log message from Spring Boot look like this:
2017-01-10 16:52:38.427 INFO 16136 --- [ main] com.operative.Application : Starting Application v1.4.0.RELEASE with PID 16136 (/opt/operative/connect-platform/connect-platform.jar started by connect in /opt/operative/connect-platform)
2017-01-10 16:52:38.442 INFO 16136 --- [ main] com.operative.Application : No active profile set, falling back to default profiles: default
2017-01-10 16:52:38.643 INFO 16136 --- [ main] ationConfigEmbeddedWebApplicationContext : Refreshing org.springframework.boot.context.embedded.AnnotationConfigEmbeddedWebApplicationContext@63192798: startup date [Tue Jan 10 16:52:38 EST 2017]; root of context hierarchy
2017-01-10 16:52:43.661 INFO 16136 --- [ main] trationDelegate$BeanPostProcessorChecker : Bean 'spring.data.rest-org.springframework.boot.autoconfigure.data.rest.RepositoryRestProperties' of type [class org.springframework.boot.autoconfigure.data.rest.RepositoryRestProperties] is not eligible for getting processed by all BeanPostProcessors (for example: not eligible for auto-proxying)
|
The following items are output:
- Date and Time — Millisecond precision and easily sortable.
- Log Level — ERROR, WARN, INFO, DEBUG or TRACE.
- Process ID.
- A --- separator to distinguish the start of actual log messages.
- Thread name — Enclosed in square brackets (may be truncated for console output).
- Logger name — This is usually the source class name (often abbreviated).
- The log message.
More about Spring Boot logs can be found on https://docs.spring.io/spring-boot/docs/current/reference/html/boot-features-logging.html
Information about logstash configuration for different log processing
3 Configuration on Spring Boot application server
3.1 Enable Spring Boot to log message
By default, Spring Boot will only log to the console and will not write log files. If we want to write log files in addition to the console output we need to set a logging.file or logging.path property in the application.properties file.
For example:
logging.file=application.log
|
Spring Boot will now log ERROR, WARN and INFO level messages in the application.log log file and will also rotate it as it reaches 10 Mb.
3.1.1 Install Filebeat
Run the fllowing as root to install filebeat
|
# yum install filebeat-5.1.1-x86_64.rpm
|
3.1.2 Configure Filebeat to send logs to Logstash
Edit configuration file /etc/filebeat/filebeat.yml.
- Define what log files to send to logstash
….
filebeat.prospectors:
## setup for spring application logs
- input_type: log
Paths:
- /myspringapp/app.log
document_type: springboot
….
|
Details about log path can be found https://www.elastic.co/guide/en/beats/filebeat/current/filebeat-configuration.html
- Define destination(logstash host) (add in red color)
….
#-------------------------- Elasticsearch output ------------------------------
#output.elasticsearch:
# Array of hosts to connect to.
#hosts: ["localhost:9200"]
# Optional protocol and basic auth credentials.
#protocol: "https"
#username: "elastic"
#password: "changeme"
#----------------------------- Logstash output --------------------------------
output.logstash:
# The Logstash hosts
hosts: ["<your elk hostname or IP>:5044"]
# Optional SSL. By default is off.
# List of root certificates for HTTPS server verifications
#ssl.certificate_authorities: ["/etc/pki/root/ca.pem"]
# Certificate for SSL client authentication
#ssl.certificate: "/etc/pki/client/cert.pem"
# Client Certificate Key
#ssl.key: "/etc/pki/client/cert.key"
….
|
Note: this example does not SSL, you should consider that in production environment.
- To test the configuration file syntax
# /usr/bin/filebeat.sh -configtest -e
2017/01/10 18:53:32.685373 beat.go:267: INFO Home path: [/usr/share/filebeat] Config path: [/etc/filebeat] Data path: [/var/lib/filebeat] Logs path: [/var/log/filebeat]
2017/01/10 18:53:32.685394 beat.go:177: INFO Setup Beat: filebeat; Version: 5.1.1
2017/01/10 18:53:32.685427 logstash.go:90: INFO Max Retries set to: 3
2017/01/10 18:53:32.685454 outputs.go:106: INFO Activated logstash as output plugin.
2017/01/10 18:53:32.685492 publish.go:291: INFO Publisher name: client1
2017/01/10 18:53:32.691684 async.go:63: INFO Flush Interval set to: 1s
2017/01/10 18:53:32.691701 async.go:64: INFO Max Bulk Size set to: 2048
Config OK
|
- Restart filebeat
# service filebeat restart
|
- Check the filebeat log file under
# tail -f /var/log/filebeat/filebeat
|
After filebeat has started, data will pump to logstash host under the file
/var/log/logstash/logstash-plain.log
4 Configuration on Logstash server
Edit file /etc/logstash/conf.d/10-beats-input.con
input {
beats {
port => 5044
codec => multiline {
pattern => "^%{YEAR}-%{MONTHNUM}-%{MONTHDAY} %{TIME}.*"
negate => "true"
what => "previous"
}
}
}
|
In this configuration,
- logstash will listen on port 5044 for incoming beats input
- We're using multiline codec which means that multiple lines may correspond to a single log event,
- In order to detect lines that should logically be grouped with a previous line we use a detection pattern:
- pattern => "^%{YEAR}-%{MONTHNUM}-%{MONTHDAY} %{TIME}.*" → Each new log event needs to start with date.
- negate => "true" → if it doesn't start with a date ...
- what => "previous" → ... then it should be grouped with a previous line.
Edit file /etc/logstash/conf.d/21-springboot-filter.conf
filter {
if [type] == "springboot" {
#If log line contains tab character followed by 'at' then we will tag that entry as stacktrace
if [message] =~ "\tat" {
grok {
match => ["message", "^(\tat)"]
add_tag => ["stacktrace"]
}
}
#Grokking Spring Boot's default log format
grok {
match => [ "message",
"(?<timestamp>%{YEAR}-%{MONTHNUM}-%{MONTHDAY} %{TIME}) %{LOGLEVEL:level} %{NUMBER:pid} --- \[(?<thread>[A-Za-z0-9-]+)\] [A-Za-z0-9.]*\.(?<class>[A-Za-z0-9#_]+)\s*:\s+(?<logmessage>.*)",
"message",
"(?<timestamp>%{YEAR}-%{MONTHNUM}-%{MONTHDAY} %{TIME}) %{LOGLEVEL:level} %{NUMBER:pid} --- .+? :\s+(?<logmessage>.*)"
]
}
#Parsing out timestamps which are in timestamp field thanks to previous grok section
date {
match => [ "timestamp" , "yyyy-MM-dd HH:mm:ss.SSS" ]
}
}
}
|
Explanation:
- This filter looks for logs that are labeled as "springboot" type (sent by Filebeat), and it will try to use grok to parse incoming syslog logs to make it structured and query-able.
- if [message] =~ "\tat" → If message contains tab character followed by at (this is ruby syntax) then...
- ... use the grok plugin to tag stacktraces:
- match => ["message", "^(\tat)"] → when message matches beginning of the line followed by tab followed by at then...
- add_tag => ["stacktrace"] → ... tag the event with stacktrace tag.
- Use the grok plugin for regular Spring Boot log message parsing:
- First pattern extracts timestamp, level, pid, thread, class name (this is actually logger name) and the log message.
- Unfortunately, some log messages don't have logger name that resembles a class name (for example, Tomcat logs) hence the second pattern that will skip the logger/class field and parse out timestamp, level, pid, thread and the log message.
- Use date plugin to parse and set the event date:
- match => [ "timestamp" , "yyyy-MM-dd HH:mm:ss.SSS" ] → timestamp field (grokked earlier) contains the timestamp in the specified format
Edit /etc/logstash/conf.d/30-elasticsearch-output.conf
output {
elasticsearch {
hosts => ["localhost:9200"]
sniffing => false
manage_template => false
index => "%{[@metadata][beat]}-%{+YYYY.MM.dd}"
document_type => "%{[@metadata][type]}"
}
}
|
This configuration tell Logstash send output to Elasticsearch
Now, restart logstash
# initctl restart logstash
|
5 Searching and filtering log messages with Kibana
Open a web browser and go to http://<ELK host>:5601

Click on “filebeat-*”

Now click on the blue star to set filebeat as the default index
Now click on “Discovery”
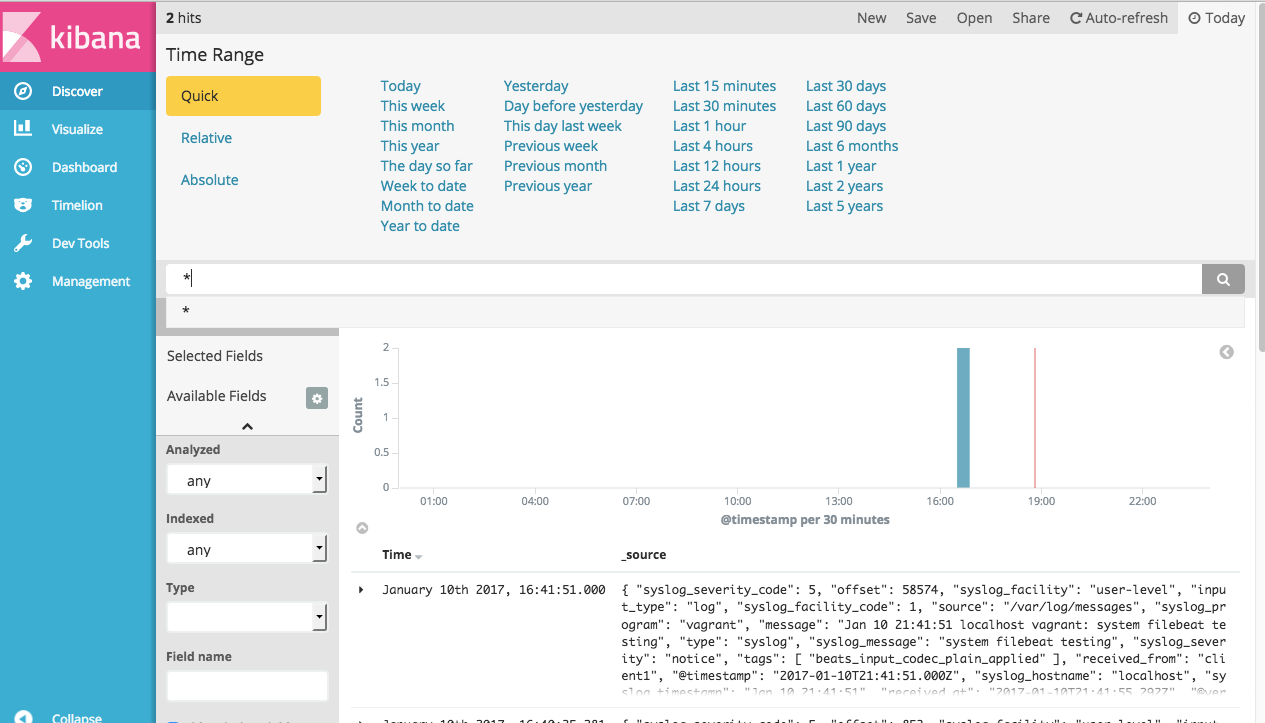
By default, discovery looks for last 15 minutes data, you might want to extend the search period to check more data.
You can get more information about how to use Kibana in the following documentation:
Really nice blog post. provided a helpful information. I hope that you will post more updates like this
ReplyDeleteAWS Online Training